Using maps to understand the spatial and temporal changes of glaciers
How do we study the cryoshphere within geography?
Remote Sensing
We use satellite images to continously monitor the state of the glaciers and ice caps in the Canadian Arctic. We use satellite images from optical and radar sensors and from a wide range of space agencies.
Fieldwork
Our work also takes us into the field to study glaciers and ice caps in Canada, Svalbard, Greenland and Antarctica. We use field instruments such as ice corers, ground-penetrating radar, GPS, drones, weather stations and more to ground truth our results from remote sensing and calibrate our models.
Geographic Information System
A great way to display the results of our work is through maps. Since we are studying changes over large spatial scales, it is important to have GIS skills to create inuitive figures of our results. Maps are a great way to disseminate our research, especially with all the colours! Check out the case study section below to see some examples.
Modelling
Models are great tools in glaciology, especially when observations are sparse or we want to better understand a process within a glacier. Models help us to predict how change will take place in future and in remote locations.
Glacier maps

Spatial Surface Velocities on Devon Ice Cap
A case study from the Canadian Arctic on the spatial distribution of the surface velocities and their dynamic discharge. This study was the first of its kind to produce glacier velocity maps for the entire Queen Elizabeth Islands in the Canadian Arctic Archipelago. Results from this study help future studies to understand why and where we are observing the largest mass loss of glaciers and ice caps in the Canadian Arctic Archipelago.
Map from: Van Wychen, W., D. O. Burgess, L. Gray, L.Copland, M. Sharp, J. A. Dowdeswell,and T. J. Benham (2014), Glacier veloci-ties and dynamic ice discharge from theQueen Elizabeth Islands, Nunavut,Canada, Geophys. Res. Lett., 41, 484–490,doi:10.1002/2013GL058558.
Learn more
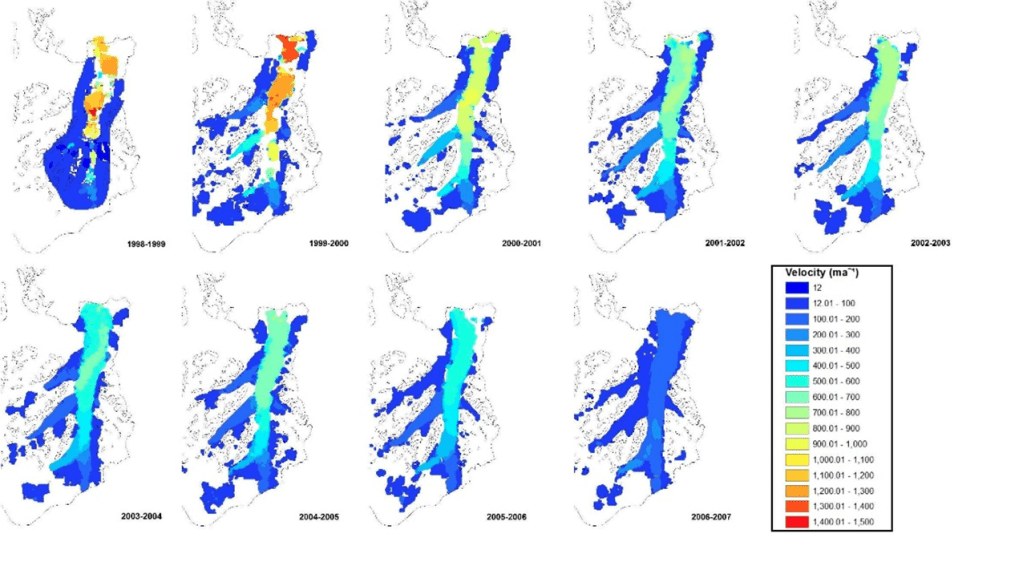
Temporal and Spatial Surface Velocity Changes on Mittie Glacier
Another case study from the Canadian Arctic in Ellesmere Island. The above map series shows the spatial evolution of a surging glacier over a nine year period. Displaying the velocity glacier allows us to see where on the glacier the surge is initiated. In 2003, Mittie Glacier increased regional dynamic discharge by 35% from the Queen Elizabeth Islands due to its active phase within its surge cycle.
Maps: By Danielle Hallé
